If you’re already familiar with Sales Funnels, this article will show you how to find the information you need in Onion Analytics. If you’re new to e-commerce, this article will explain the data in Sales Funnels, giving you a “data analysis lens” to start understanding what these numbers mean. Ready? Let’s dive in!
Understanding Sessions
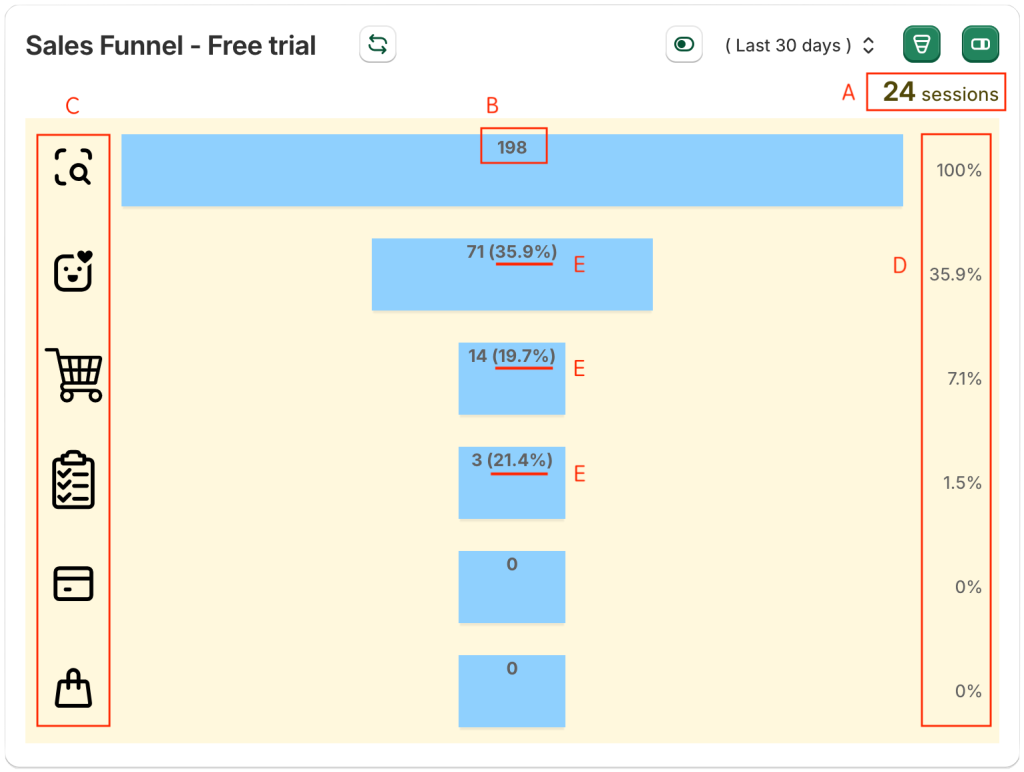
First, let’s explain what A.24 sessions means in the image: think of a session as a store visit. When a customer enters your store, they might browse several products, but it’s all counted as one session until they leave. If the same customer visits in the morning and then again in the afternoon, it counts as two sessions. Generally, a 30-minute interval is considered two separate sessions, and Onion Analytics follows this convention.
The Meaning of Awareness Data
Before explaining the 6 stages of the Sales Funnel, let’s look at what B.198 tells us about sessions.
Common analytics tools have page views, and B.198 is awareness, which includes page views, collection views, and search counts. We need to not only increase the awareness number but also pay attention to the 198 awareness / 24 sessions ratio. The higher this ratio, the more engaging your store content is, and the more time customers spend exploring your store.
The Six Stages of the Sales Funnel
We’ve divided the Sales Funnel into 6 stages based on the Shopify store flow. Some tools or theories might use 4 or 5 layers, but the purpose is the same: to clearly identify which parts of the “customer journey from entering the store to checkout” need improvement to provide a better customer experience.
The table below lists the behaviors included in each layer of the Sales Funnel we created:
Note: The basic concept of the sales funnel is to observe behaviors and their possible intentions.
Awareness View landing pages, view collection pages, and search keywords. Interest View product pages. Consideration Add products to cart, view cart. Intent Check process. Evaluation Fill in payment info. Purchase Complete the order


Icons and Descriptions
To help you intuitively remember the meaning of each stage, we’ve chosen appropriate icons for each stage (as shown in C). We recommend spending some time getting familiar with the behaviors included in each stage.
Don’t worry if you forget; just hover over the icons in the app to see a text description.
Conversion Rate Calculations
Finally, let’s look at the D and E data. D represents the overall conversion rate:
For example, for the 4th layer, Intent ⇒ 3 / 198 = 1.5%
E is the conversion rate based on the previous layer’s data:
For the 4th layer, Intent ⇒ 3 / 14 = 21.4%
You might wonder why there are two calculation methods. Typically, the further down the funnel, the faster the data drops. If the 4th layer’s 3 increases to 5, in D’s calculation, it only goes from 1.5% to 2.5%, whereas in E’s calculation, it goes from 21.4% to 35.7%.
When the Awareness number is large, it’s hard to see improvements at the end of the Sales Funnel using the overall conversion rate D. At this point, referencing E’s data can more accurately capture the effectiveness of conversion rate optimizations.


